Example
Input Configuration
In this example, the simulated configuration is based on the real floor plan of a research center. The floor plan is only shown for illustration purposes and is not required to run the simulator. As explained in the Components section, the simulator only requires information about the types of events that can occur, places’ spatial parameters (area & capacity), the number of people initially present and the aerosol model physical parameters.
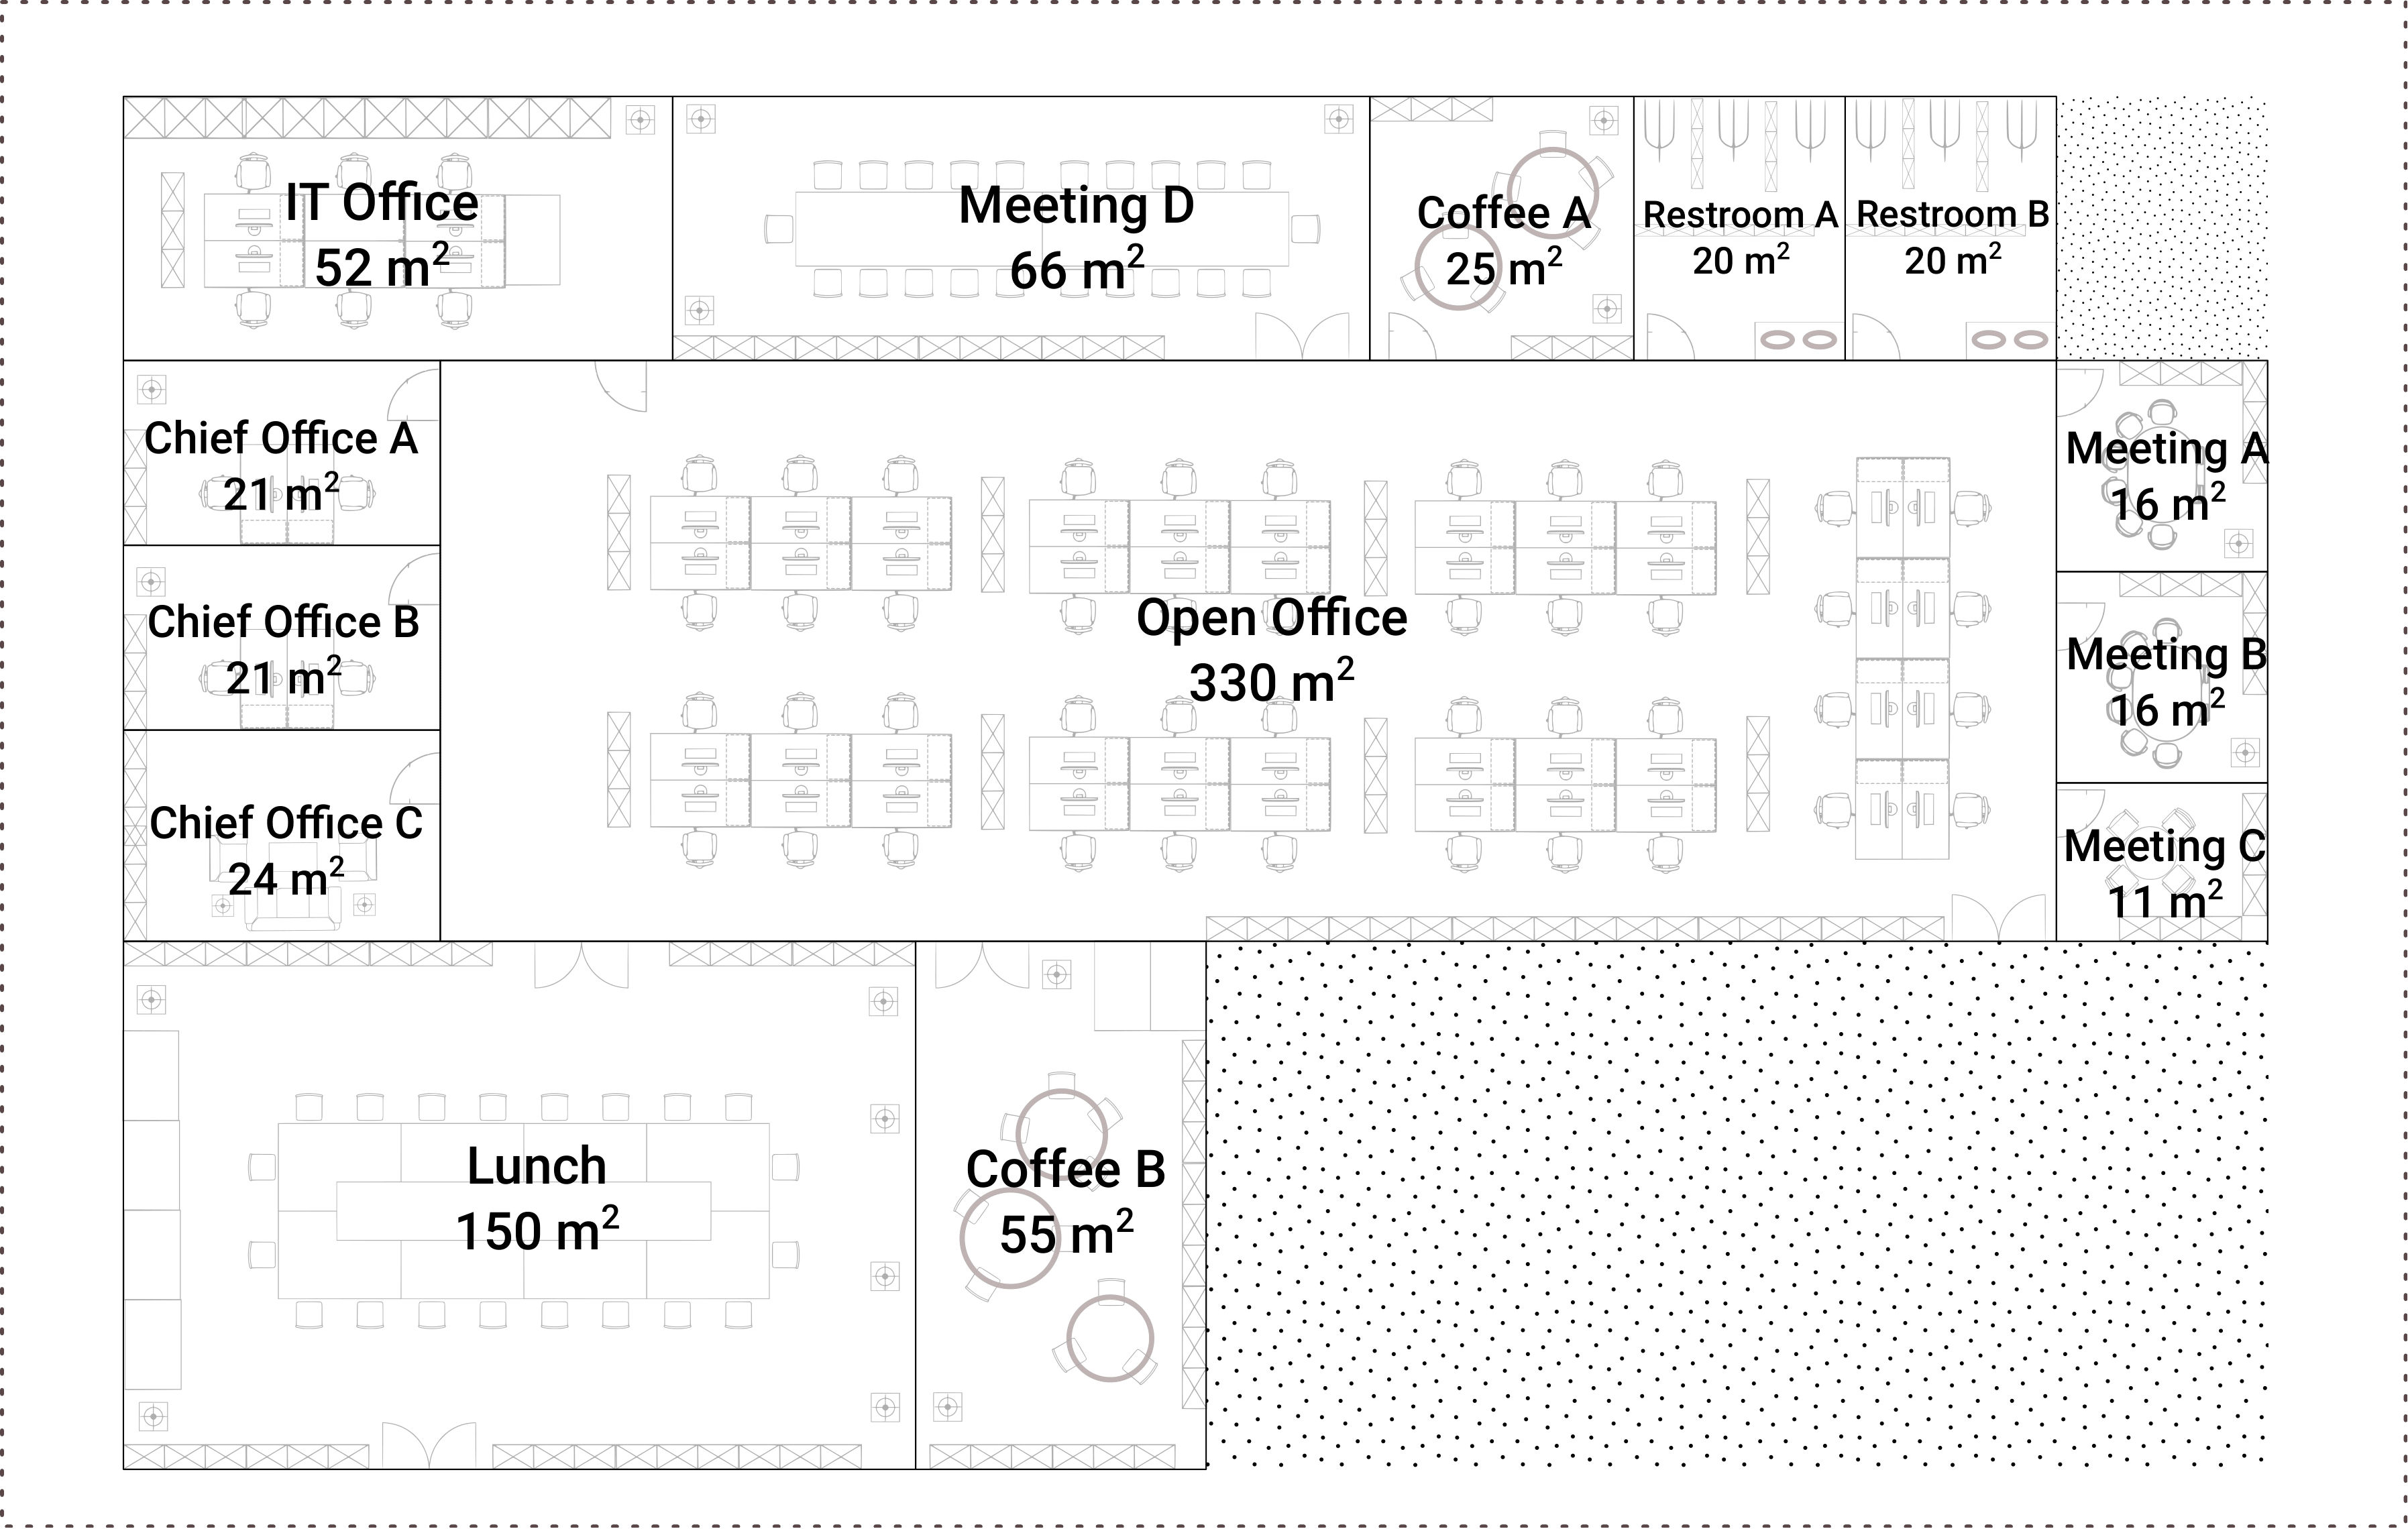
Figure 1: Building floor plan used in the example
Events
The events’ parameters are summarized in Table 1: Events parameters. There are five types of events: work, meeting, coffee, restroom, and lunch. Meetings and lunch activities are regarded as collective events. Each event model is limited to a certain schedule, duration \(\tau\), and a number of repetitions. For each event model, the mask efficiency \(m_e\) is also defined (not used anywhere \(m_e=0\)).

Table 1: Events parameters
Places
Places’ parameters are summarized in Table 2: Places parameters. The floor area of each location is measured, and the volume \(V\) is estimated assuming a height of 2.7 m. The initial number of people present \(N\), the maximum number of people that can fit in the room, and the ventilation rates (both active \(\lambda_r\) and passive \(\lambda_a\)) are also defined. Meeting rooms A, B, C, and restrooms A and B are subject to poor passive ventilation, as they are oriented towards the interior of the building and do not have direct access to a window. A low passive ventilation rate is established (\(\lambda_a=1.5\), and \(\lambda_a=0.5\) for poor ventilated rooms) and there is no active ventilation (:math:`lambda_r=0$).
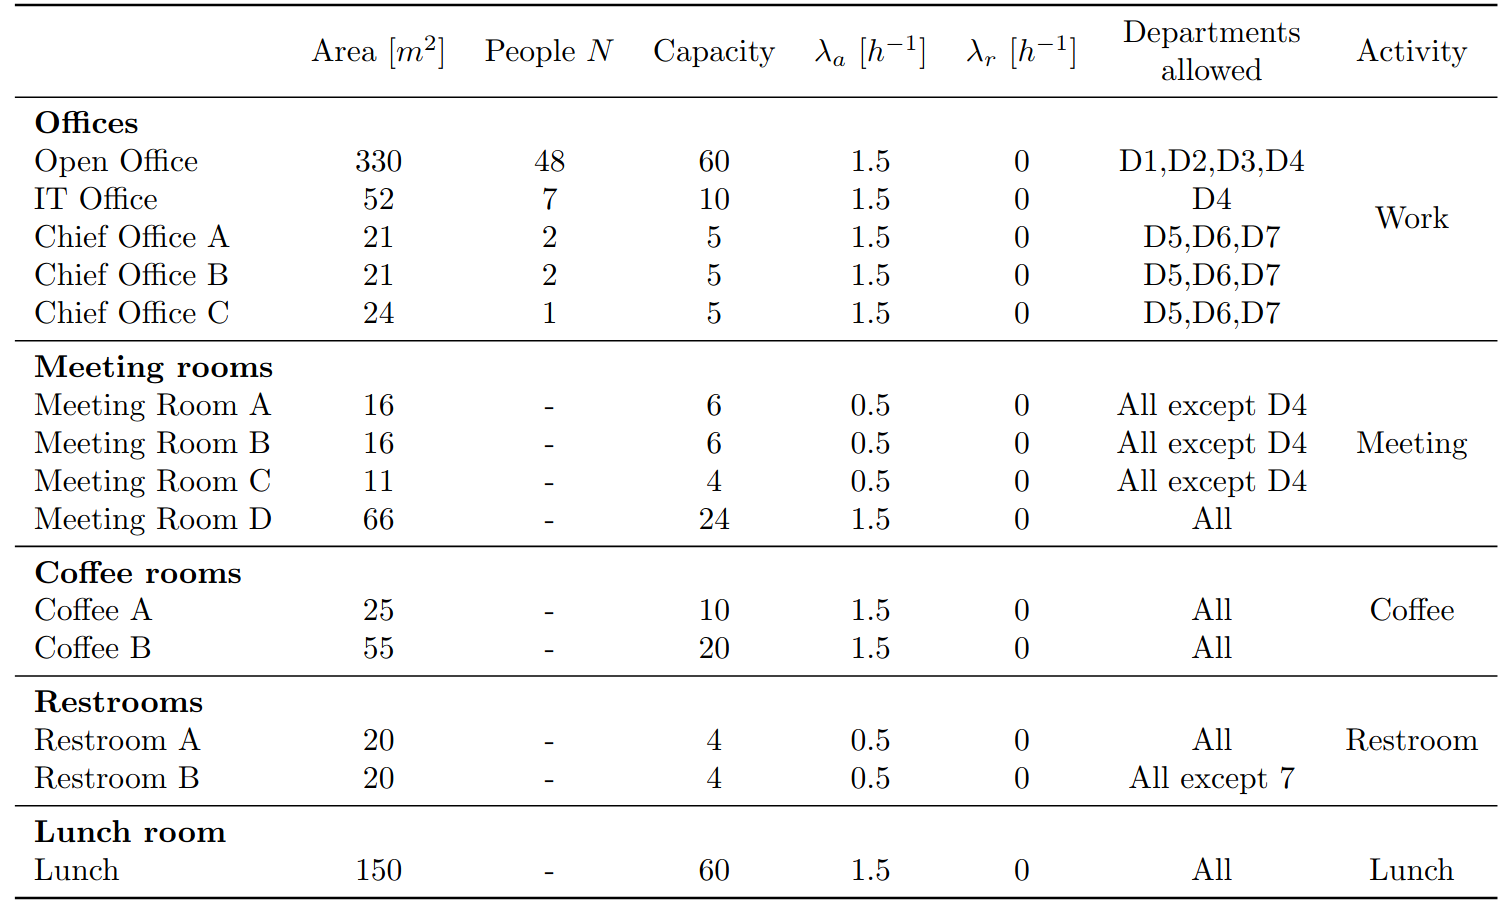
Table 2: Places parameters
People
There are 60 people distributed in 7 different departments: D1, D2, and D3 have 16 people each; D4 refers to 7 IT workers, and D5, D6, D7 hold the head of departments, with 2, 2, and 1 people respectively. The number of infected people \(N_i\) is set to 3 in all the proposed scenarios.
Aerosol Model
The aerosol model presented by Peng and Jimenez [MNJ+21, PBB+21, PJ21]. derives analytical expressions of CO2 based risk proxies, assuming the social distance is maintained. The relative infection risk in a given environment scales with excess CO2 level, and thus, keeping CO2 as low as possible is essential to reducing the likelihood of infection. This model calculates both the virus quanta concentration and the CO2 mixing ratio present in a specific place. These two metrics provide an overall picture of indoor air quality, which is why this model was selected for ArchABM.
The aerosol model considers some parameters to be constant across the entire building, as shown in Table 3: Aerosol model constant parameters. These constant values, breathing or virus related, are based on the study undertaken by Peng and Jimenez. On the contrary, certain parameters are specified for each place, such as volume, ventilation, or the number of people present, as shown in Table 4: Aerosol model variable parameters.

Table 3: Aerosol model constant parameters
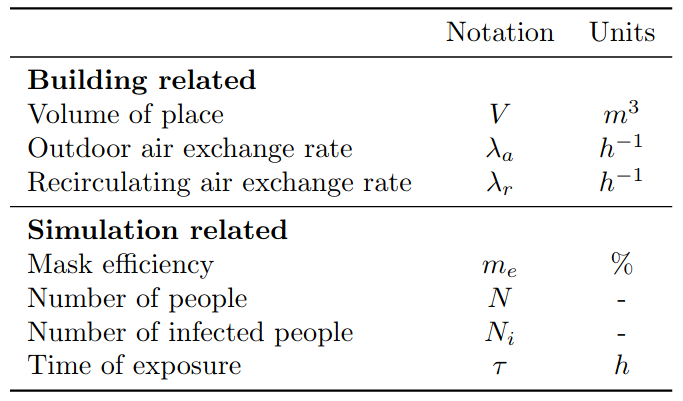
Table 4: Aerosol model variable parameters
Generated config.json
config.json
{
    "events": [{
            "activity": "home",
            "schedule": [
                [0, 480],
                [1020, 1440]
            ],
            "repeat_min": 0,
            "repeat_max": null,
            "duration_min": 300,
            "duration_max": 360,
            "mask_efficiency": null,
            "collective": false,
            "shared": false,
            "allow": true
        },
        {
            "activity": "work",
            "schedule": [
                [480, 1020]
            ],
            "repeat_min": 0,
            "repeat_max": null,
            "duration_min": 30,
            "duration_max": 60,
            "mask_efficiency": 0.0,
            "collective": false,
            "shared": true,
            "allow": true
        },
        {
            "activity": "meeting",
            "schedule": [
                [540, 960]
            ],
            "repeat_min": 0,
            "repeat_max": 5,
            "duration_min": 20,
            "duration_max": 90,
            "mask_efficiency": 0.0,
            "collective": true,
            "shared": true,
            "allow": true
        },
        {
            "activity": "lunch",
            "schedule": [
                [780, 900]
            ],
            "repeat_min": 1,
            "repeat_max": 1,
            "duration_min": 20,
            "duration_max": 45,
            "mask_efficiency": 0.0,
            "collective": true,
            "shared": true,
            "allow": true
        },
        {
            "activity": "coffee",
            "schedule": [
                [600, 660],
                [900, 960]
            ],
            "repeat_min": 0,
            "repeat_max": 2,
            "duration_min": 5,
            "duration_max": 15,
            "mask_efficiency": 0.0,
            "collective": true,
            "shared": true,
            "allow": true
        },
        {
            "activity": "restroom",
            "schedule": [
                [480, 1020]
            ],
            "repeat_min": 0,
            "repeat_max": 4,
            "duration_min": 3,
            "duration_max": 6,
            "mask_efficiency": 0.0,
            "collective": false,
            "shared": true,
            "allow": true
        }
    ],
    "places": [{
            "name": "home",
            "activity": ["home"],
            "building": null,
            "department": null,
            "area": null,
            "height": null,
            "capacity": null,
            "ventilation": null,
            "recirculated_flow_rate": null,
            "allow": true
        },
        {
            "name": "open_office",
            "activity": ["work"],
            "building": "building1",
            "department": ["department1", "department2", "department3", "department4"],
            "area": 330.0,
            "height": 2.7,
            "capacity": 60,
            "ventilation": 1.5,
            "recirculated_flow_rate": 0,
            "allow": true
        },
        {
            "name": "it_office",
            "activity": ["work"],
            "building": "building1",
            "department": ["department4"],
            "area": 52.0,
            "height": 2.7,
            "capacity": 10,
            "ventilation": 1.5,
            "recirculated_flow_rate": 0,
            "allow": true
        },
        {
            "name": "chief_office_A",
            "activity": ["work"],
            "building": "building1",
            "department": ["department5", "department6", "department7"],
            "area": 21.0,
            "height": 2.7,
            "capacity": 5,
            "ventilation": 1.5,
            "recirculated_flow_rate": 0,
            "allow": true
        },
        {
            "name": "chief_office_B",
            "activity": ["work"],
            "building": "building1",
            "department": ["department5", "department6", "department7"],
            "area": 21.0,
            "height": 2.7,
            "capacity": 5,
            "ventilation": 1.5,
            "recirculated_flow_rate": 0,
            "allow": true
        },
        {
            "name": "chief_office_C",
            "activity": ["work"],
            "building": "building1",
            "department": ["department5", "department6", "department7"],
            "area": 24.0,
            "height": 2.7,
            "capacity": 5,
            "ventilation": 1.5,
            "recirculated_flow_rate": 0,
            "allow": true
        },
        {
            "name": "meeting_A",
            "activity": ["meeting"],
            "building": "building1",
            "department": ["department1", "department2", "department3", "department5", "department6", "department7"],
            "area": 16.0,
            "height": 2.7,
            "capacity": 6,
            "ventilation": 1.0,
            "recirculated_flow_rate": 0,
            "allow": true
        },
        {
            "name": "meeting_B",
            "activity": ["meeting"],
            "building": "building1",
            "department": ["department1", "department2", "department3", "department5", "department6", "department7"],
            "area": 16.0,
            "height": 2.7,
            "capacity": 6,
            "ventilation": 1.0,
            "recirculated_flow_rate": 0,
            "allow": true
        },
        {
            "name": "meeting_C",
            "activity": ["meeting"],
            "building": "building1",
            "department": ["department1", "department2", "department3", "department5", "department6", "department7"],
            "area": 11.0,
            "height": 2.7,
            "capacity": 4,
            "ventilation": 1.0,
            "recirculated_flow_rate": 0,
            "allow": true
        },
        {
            "name": "meeting_D",
            "activity": ["meeting"],
            "building": "building1",
            "department": null,
            "area": 66.0,
            "height": 2.7,
            "capacity": 24,
            "ventilation": 1.5,
            "recirculated_flow_rate": 0,
            "allow": true
        },
        {
            "name": "coffee_A",
            "activity": ["coffee"],
            "building": "building1",
            "department": null,
            "area": 25.0,
            "height": 2.7,
            "capacity": 10,
            "ventilation": 1.5,
            "recirculated_flow_rate": 0,
            "allow": true
        },
        {
            "name": "coffee_B",
            "activity": ["coffee"],
            "building": "building1",
            "department": null,
            "area": 55.0,
            "height": 2.7,
            "capacity": 20,
            "ventilation": 1.5,
            "recirculated_flow_rate": 0,
            "allow": true
        },
        {
            "name": "restroom_A",
            "activity": ["restroom"],
            "building": "building1",
            "department": null,
            "area": 20.0,
            "height": 2.7,
            "capacity": 4,
            "ventilation": 1.0,
            "recirculated_flow_rate": 0,
            "allow": true
        },
        {
            "name": "restroom_B",
            "activity": ["restroom"],
            "building": "building1",
            "department": ["department1", "department2", "department3", "department4", "department5", "department6"],
            "area": 20.0,
            "height": 2.7,
            "capacity": 4,
            "ventilation": 1.0,
            "recirculated_flow_rate": 0,
            "allow": true
        },
        {
            "name": "lunch",
            "activity": ["lunch"],
            "building": "building1",
            "department": null,
            "area": 150.0,
            "height": 2.7,
            "capacity": 60,
            "ventilation": 1.5,
            "recirculated_flow_rate": 0,
            "allow": true
        }
    ],
    "people": [{
            "department": "department1",
            "building": "building1",
            "num_people": 16
        },
        {
            "department": "department2",
            "building": "building1",
            "num_people": 16
        },
        {
            "department": "department3",
            "building": "building1",
            "num_people": 16
        },
        {
            "department": "department4",
            "building": "building1",
            "num_people": 7
        },
        {
            "department": "department5",
            "building": "building1",
            "num_people": 2
        },
        {
            "department": "department6",
            "building": "building1",
            "num_people": 2
        },
        {
            "department": "department7",
            "building": "building1",
            "num_people": 1
        }
    ],
    "options": {
        "movement_buildings": true,
        "movement_department": true,
        "number_runs": 1,
        "save_log": true,
        "save_config": true,
        "save_csv": true,
        "save_json": false,
        "return_output": true,
        "directory": null,
        "ratio_infected": 0.05,
        "model": "Colorado",
        "model_parameters": {
            "Colorado": {
                "pressure": 0.95,
                "temperature": 20,
                "CO2_background": 415,
                "decay_rate": 0.62,
                "deposition_rate": 0.3,
                "hepa_flow_rate": 0.0,
                "recirculated_flow_rate": 300,
                "filter_efficiency": 0.20,
                "ducts_removal": 0.10,
                "other_removal": 0.00,
                "fraction_immune": 0,
                "breathing_rate": 0.52,
                "CO2_emission_person": 0.005,
                "quanta_exhalation": 25,
                "quanta_enhancement": 1,
                "people_with_masks": 1.00
            }
        }
    }
}
Output Results
Regarding ArchABM’s output, whenever a new event occurs, the simulator saves the state of each person and each place in the simulation history data structure.
Raw results
people.csvstores every person’s state along time.
run |
time |
person |
status |
place |
event |
CO2_level |
quanta_inhaled |
|---|---|---|---|---|---|---|---|
0 |
1018 |
21 |
0 |
1 |
1 |
739.71 |
0.064069 |
0 |
1018 |
38 |
0 |
1 |
1 |
570.36 |
0.071002 |
0 |
1019 |
52 |
0 |
13 |
5 |
531.06 |
0.019066 |
… |
… |
… |
… |
… |
… |
… |
… |
places.csvstores every places’s state along time.
run |
time |
place |
num_people |
infective_people |
CO2_level |
quanta_level |
|---|---|---|---|---|---|---|
0 |
1018 |
1 |
47 |
3 |
739.71 |
0.016215 |
0 |
1018 |
1 |
48 |
3 |
739.71 |
0.016215 |
0 |
1019 |
13 |
2 |
0 |
573.08 |
0.003908 |
… |
… |
… |
… |
… |
… |
… |
Visualization
People metrics
Figure 2: Activity density distribution summarizes the types of events (coffee, lunch, meetings, go to the restroom, do office work) performed by all occupants throughout the day, while Figure 3: Activities performed by each person shows a detailed breakdown of the activities performed by each person throughout the day.
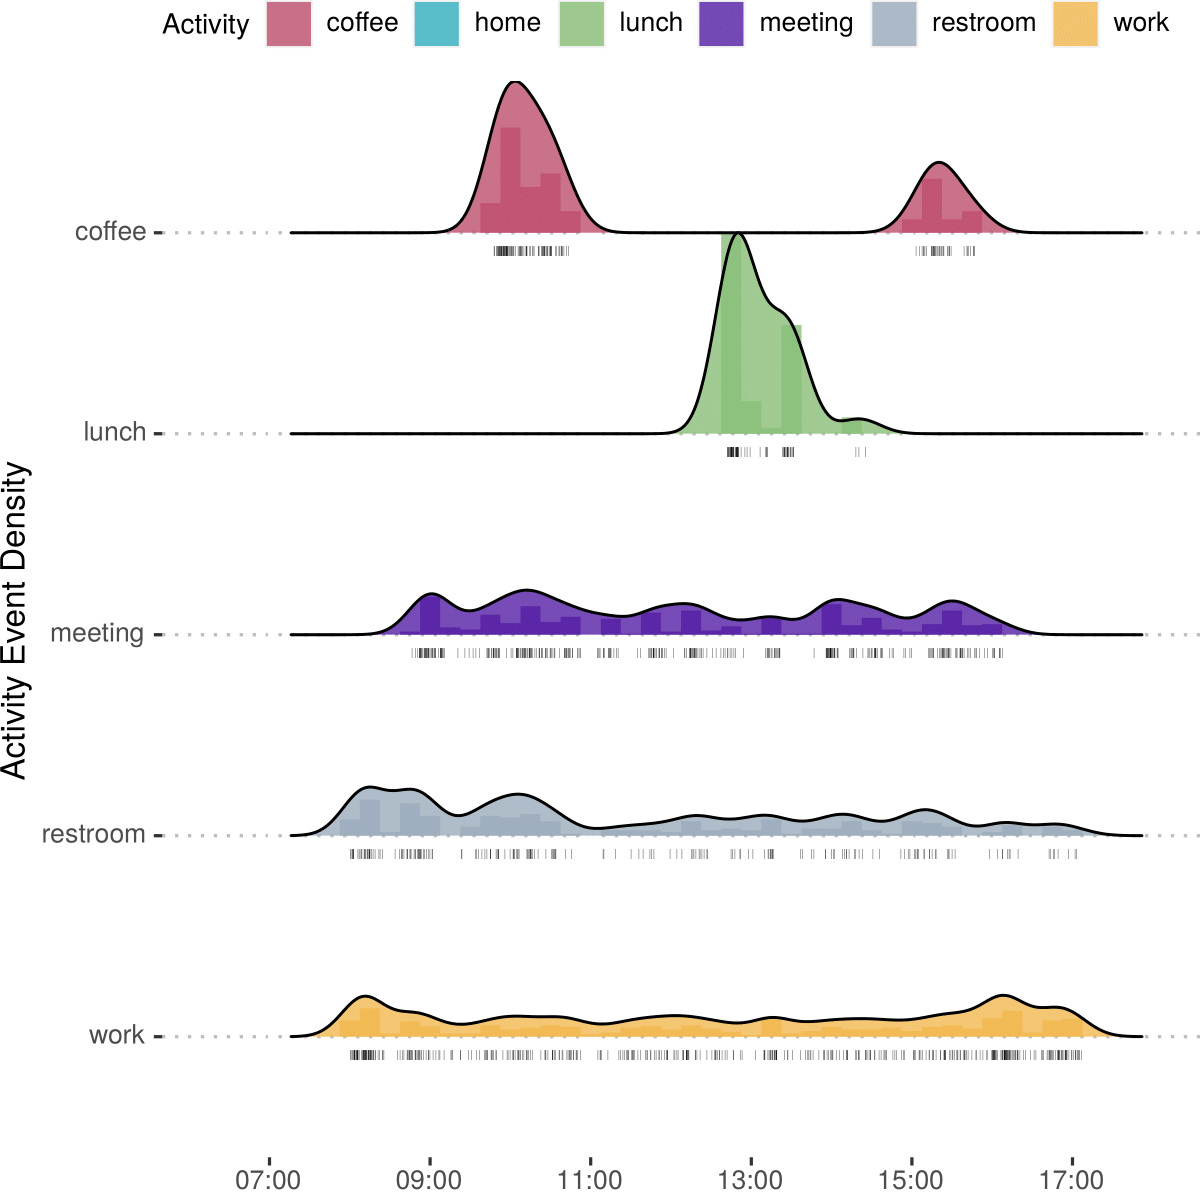
Figure 2: Activity density distribution
Agents are strictly adhering to the specified schedule, with two coffee breaks, one main lunch event, and meetings, restrooms, and work events spread throughout the day. The three randomly infected people are also highlighted in Figure 3: Activities performed by each person.
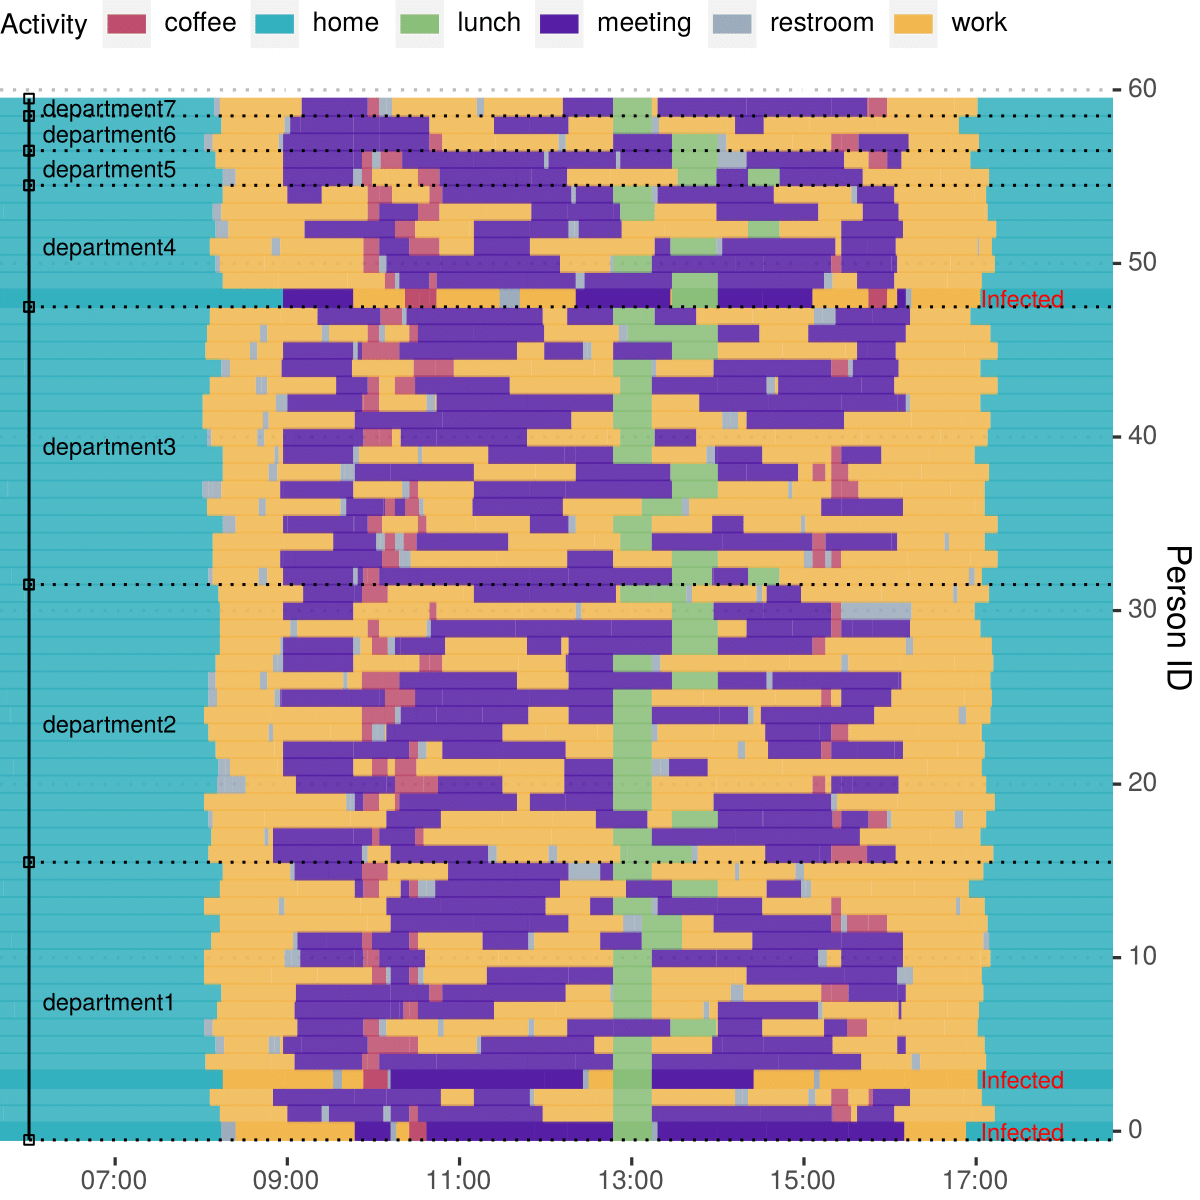
Figure 3: Activities performed by each person
The amount of quanta inhaled per person is depicted in Figure 4: Quanta inhaled per person. Each line represents a person, and the red dotted lines indicate the three infected people. The color of the line represents the activity that each agent is performing. For instance, meetings and lunch activities primarily contribute to quanta inhalation between the agents.
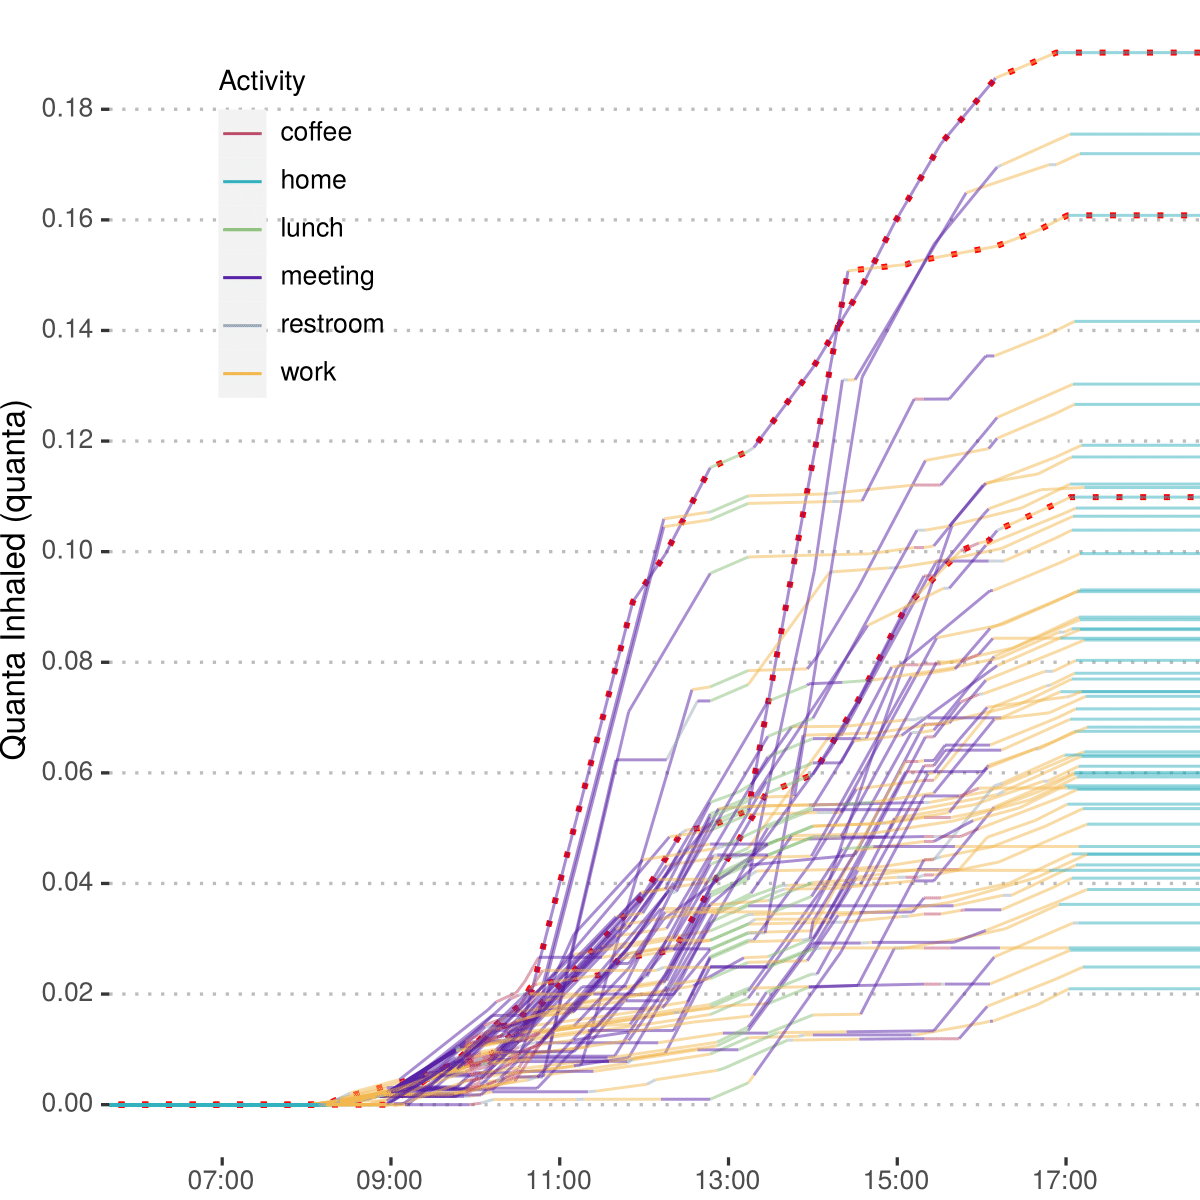
Figure 4: Quanta inhaled per person
The total quanta inhaled by each person at the end of the day is shown in Figure 5: Quanta inhaled by each person at the end of the day, and the three infected people are highlighted with red dots.
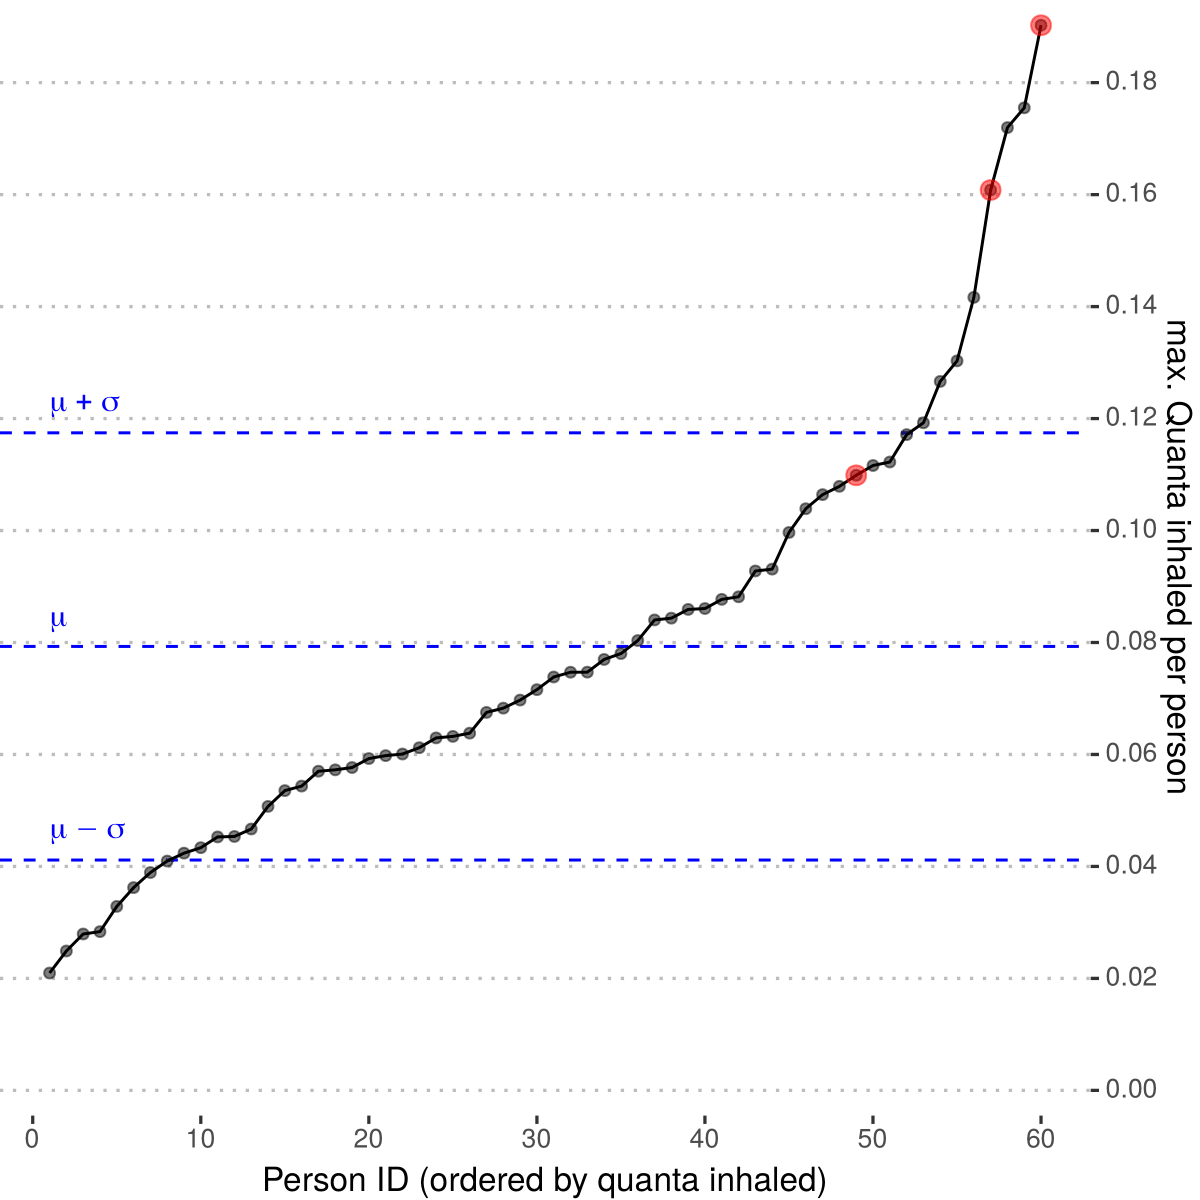
Figure 5: Quanta inhaled by each person at the end of the day
Places metrics
From the places perspective, archABM also offers the possibility of tracking the CO2 and quanta concentration levels. Examining the CO2 level at each place throughout the day (Figure 6: CO2 level at each place), it can be observed that the meeting rooms accumulate the highest CO2 concentration throughout the day. The coffee places rapidly accumulate CO2 during the coffee events, but the air quality is restored between the coffee breaks. Other rooms, for example, restrooms and office places show a more constant CO2 level.
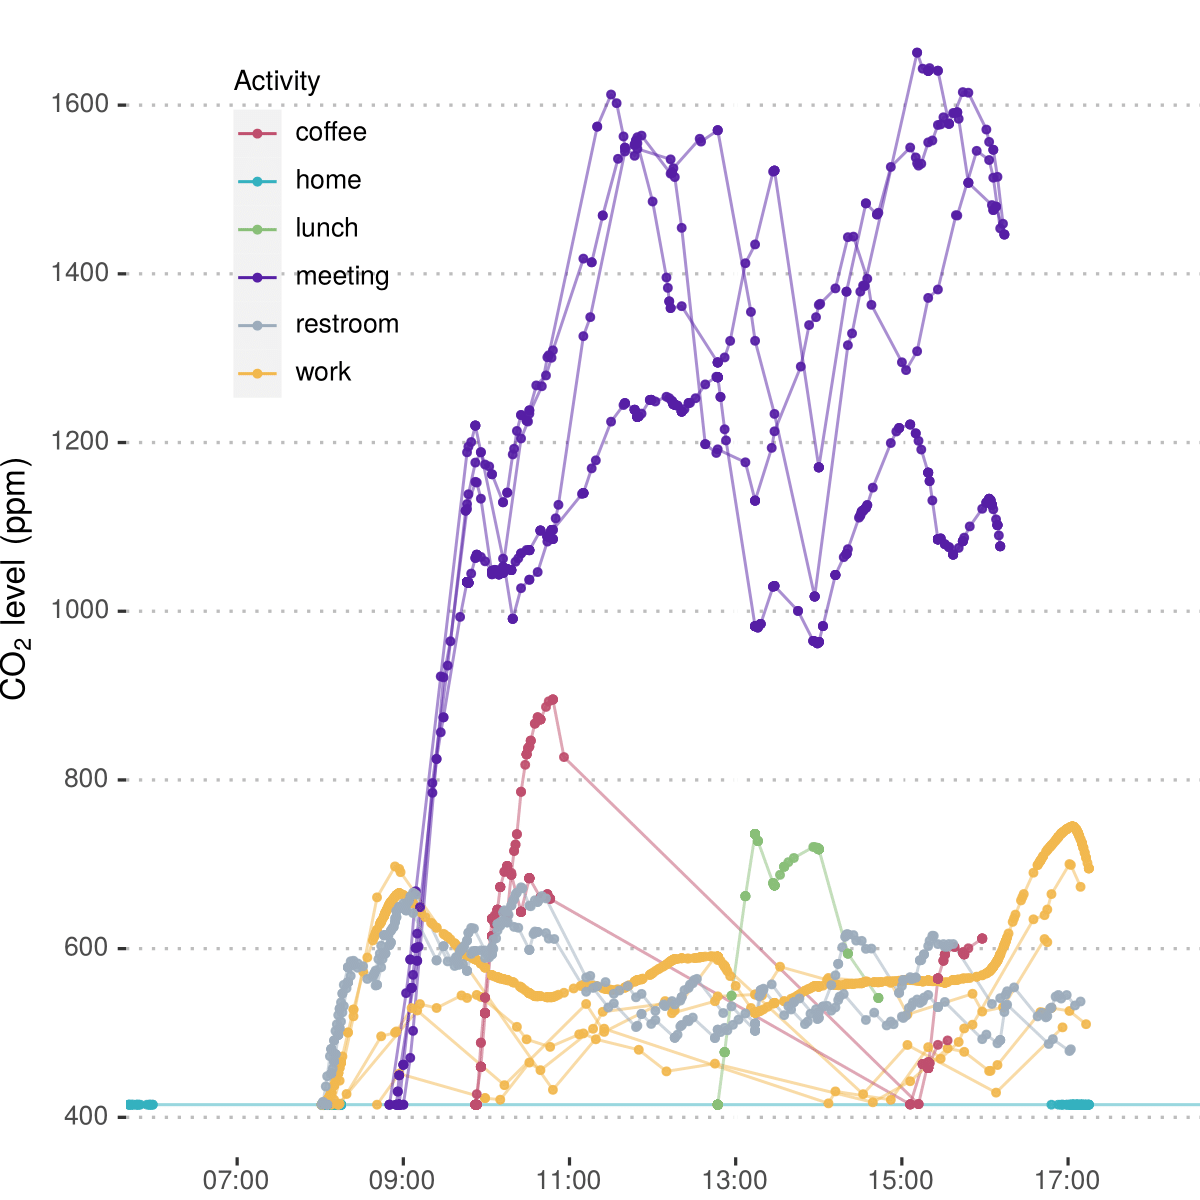
Figure 6: CO2 level at each place
The distribution of CO2 concentration can directly be observed in Figure 7: CO2 level distribution at each place, where a box-plot is overlaid on top of a violin plot.
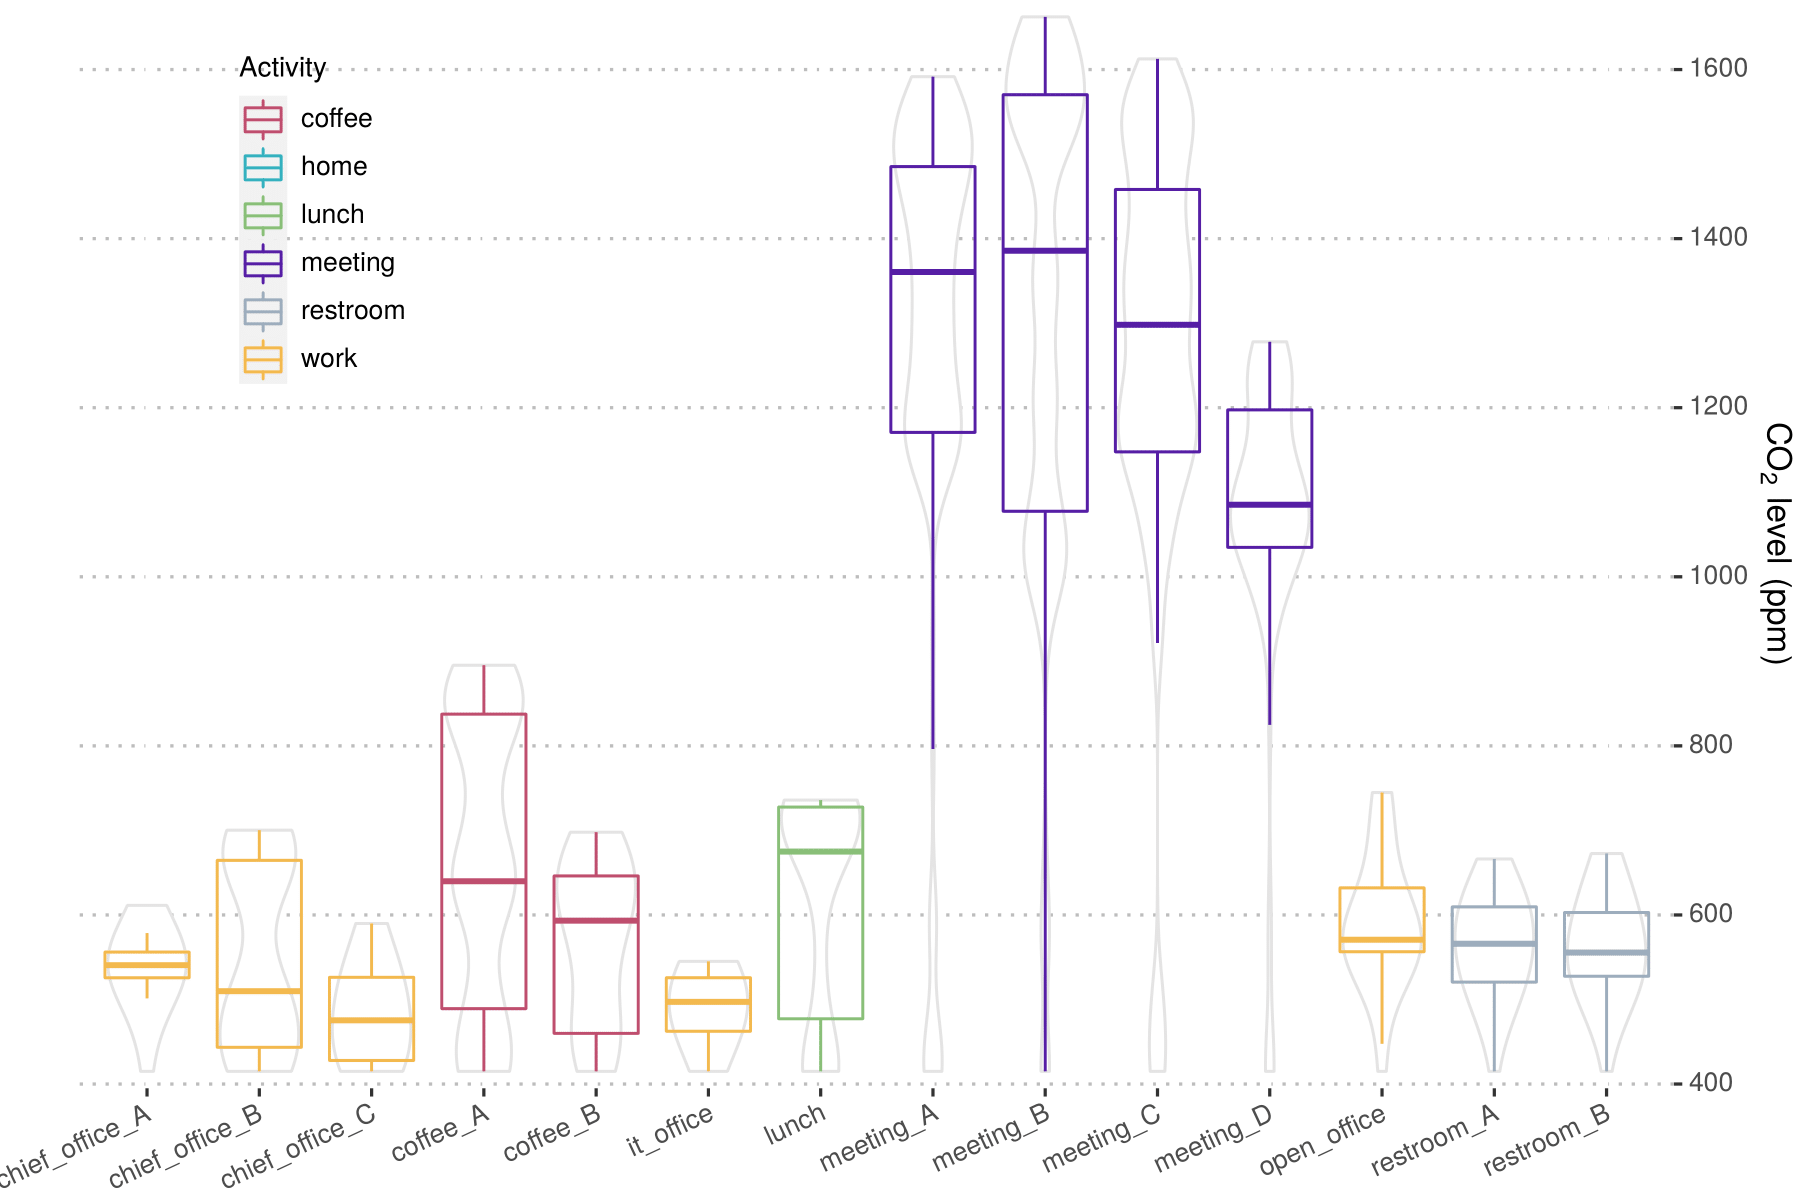
Figure 7: CO2 level distribution at each place
A similar interpretation can be concluded with the quanta concentration for this simulation run, as shown in Figure 8: quanta level at each place and Figure 9: quanta level distribution at each place.
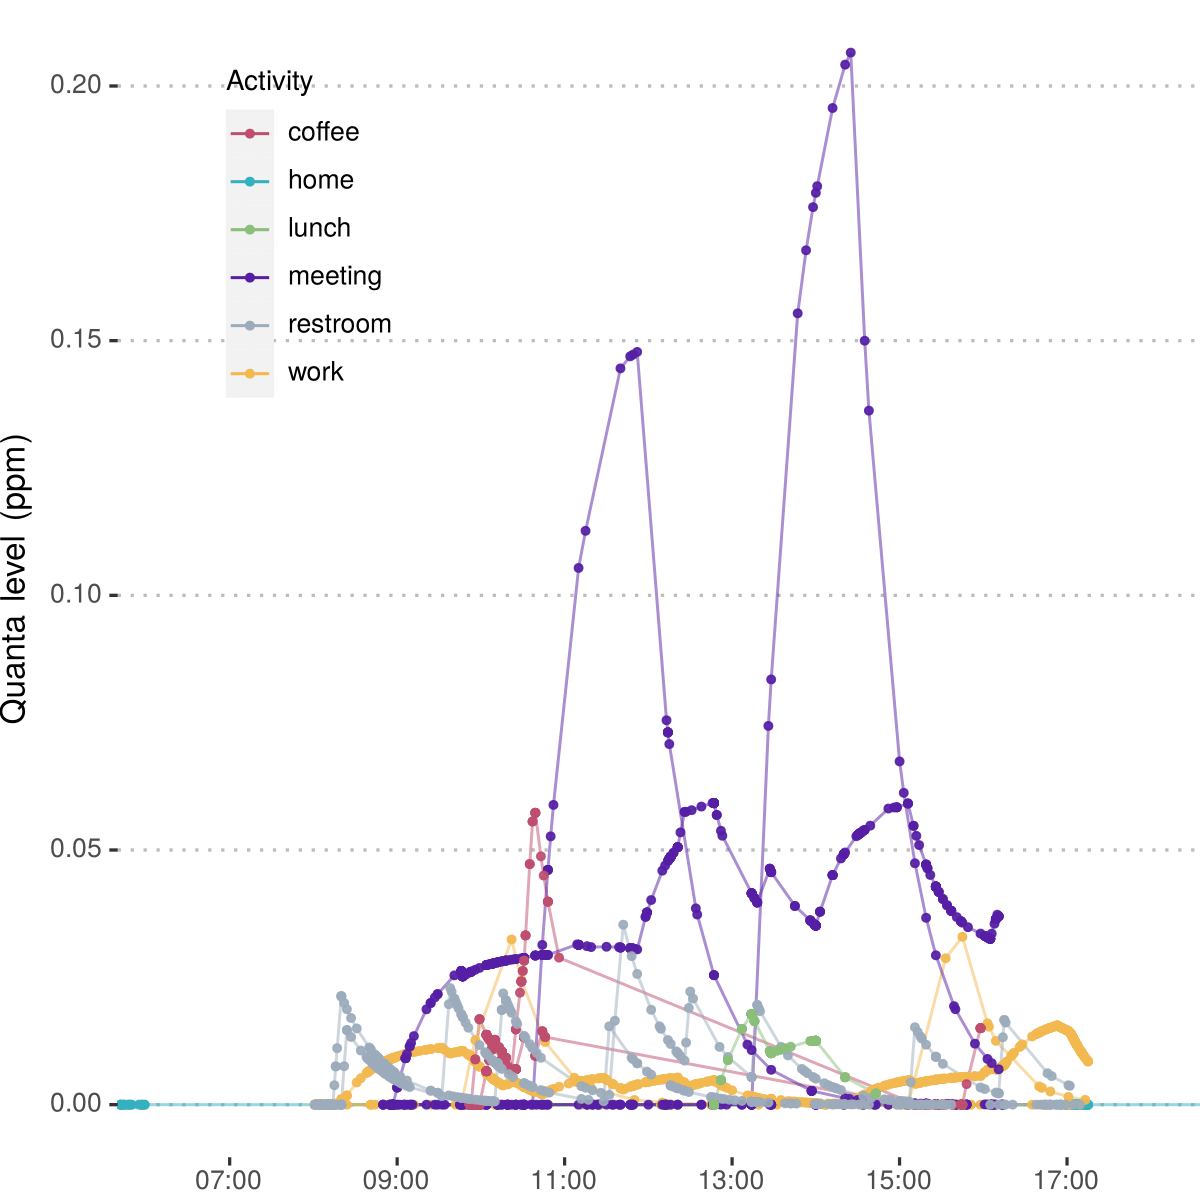
Figure 8: quanta level at each place
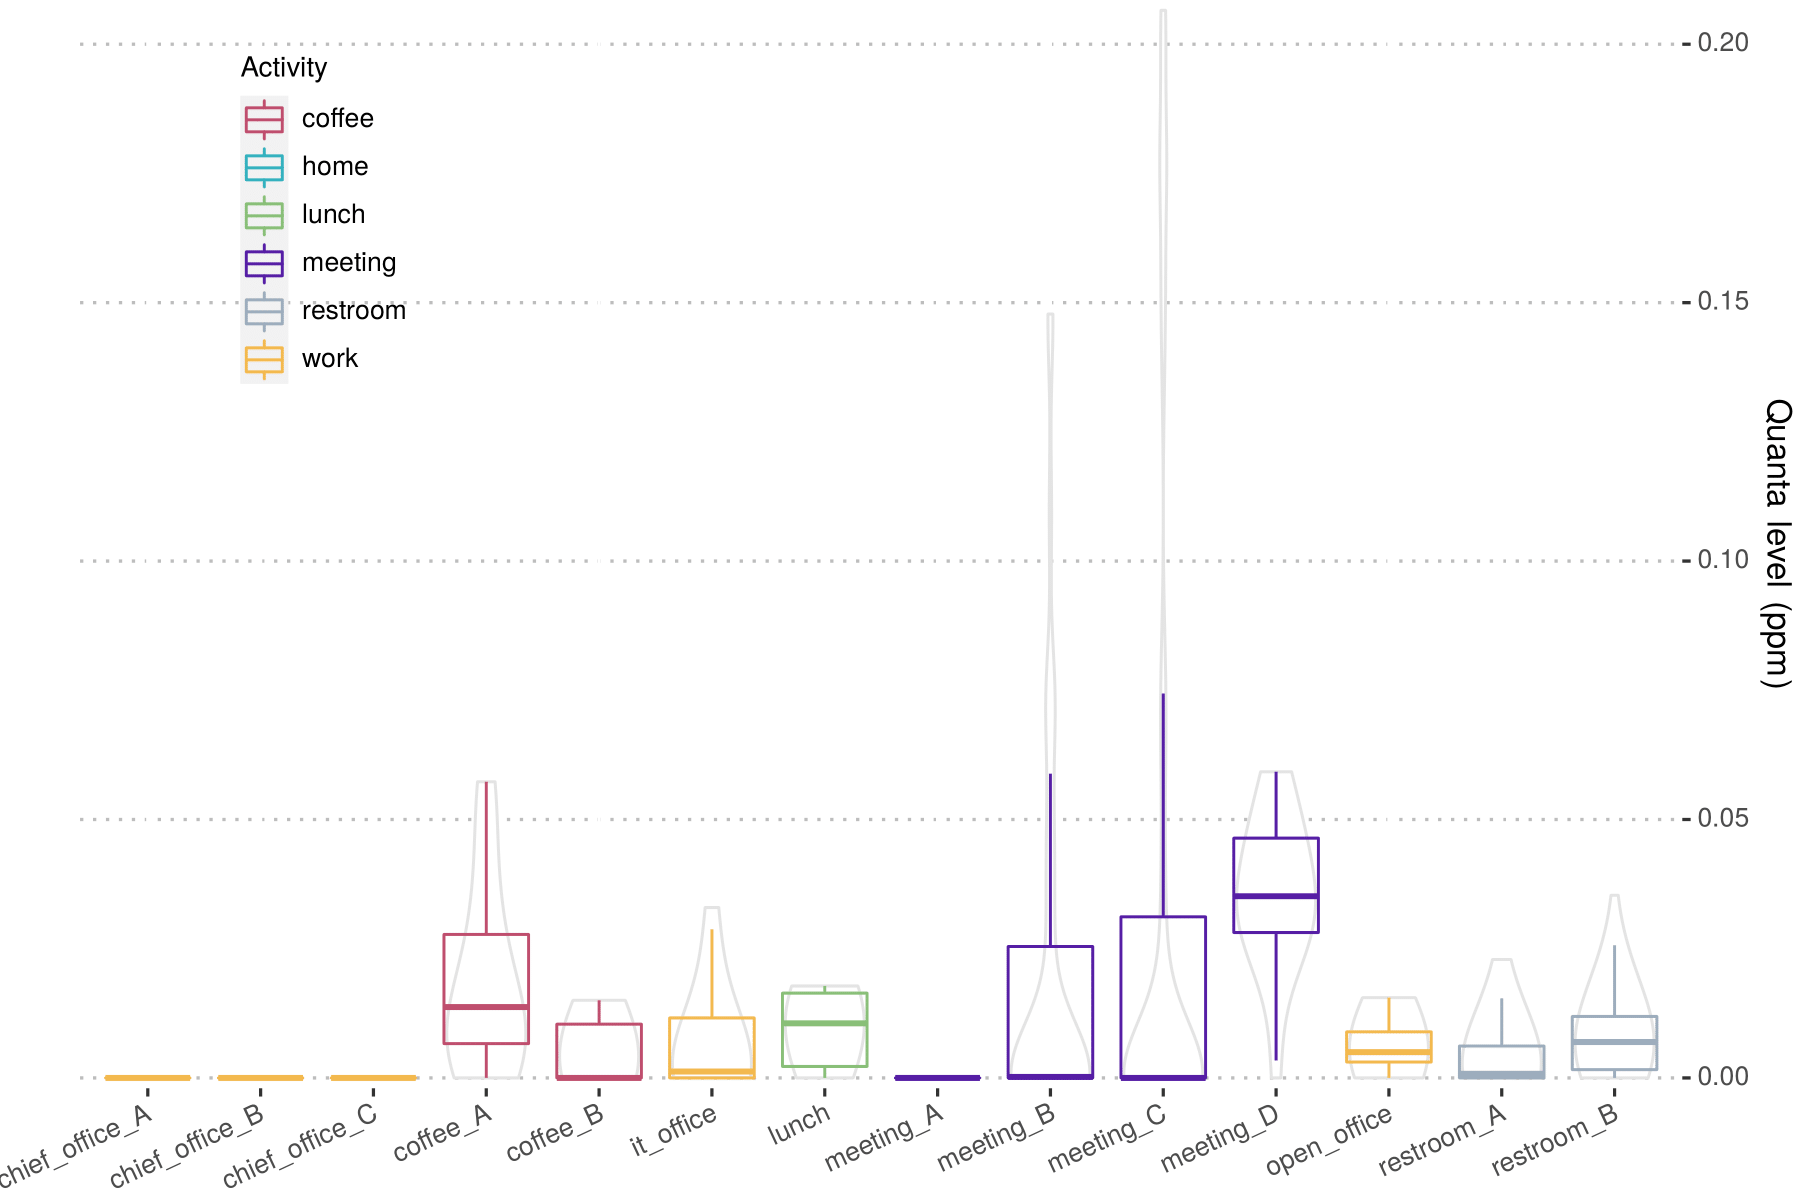
Figure 9: quanta level distribution at each place
Metrics related to indoor air quality at the place level have been overlaid on the floor plan, as shown in Figure 10: Maximum CO2 level at each place and Figure 11: Maximum quanta level at each place. Concerning the CO2 level, meeting rooms are highlighted as the worst locations. With regard to the quanta level, meeting rooms B and C come out worst in this case. These results demonstrate archABM’s capabilities of detecting “hotspots” in terms of high CO2 and virus quanta concentrations (in our case meeting rooms and the coffee place) across the entire building.
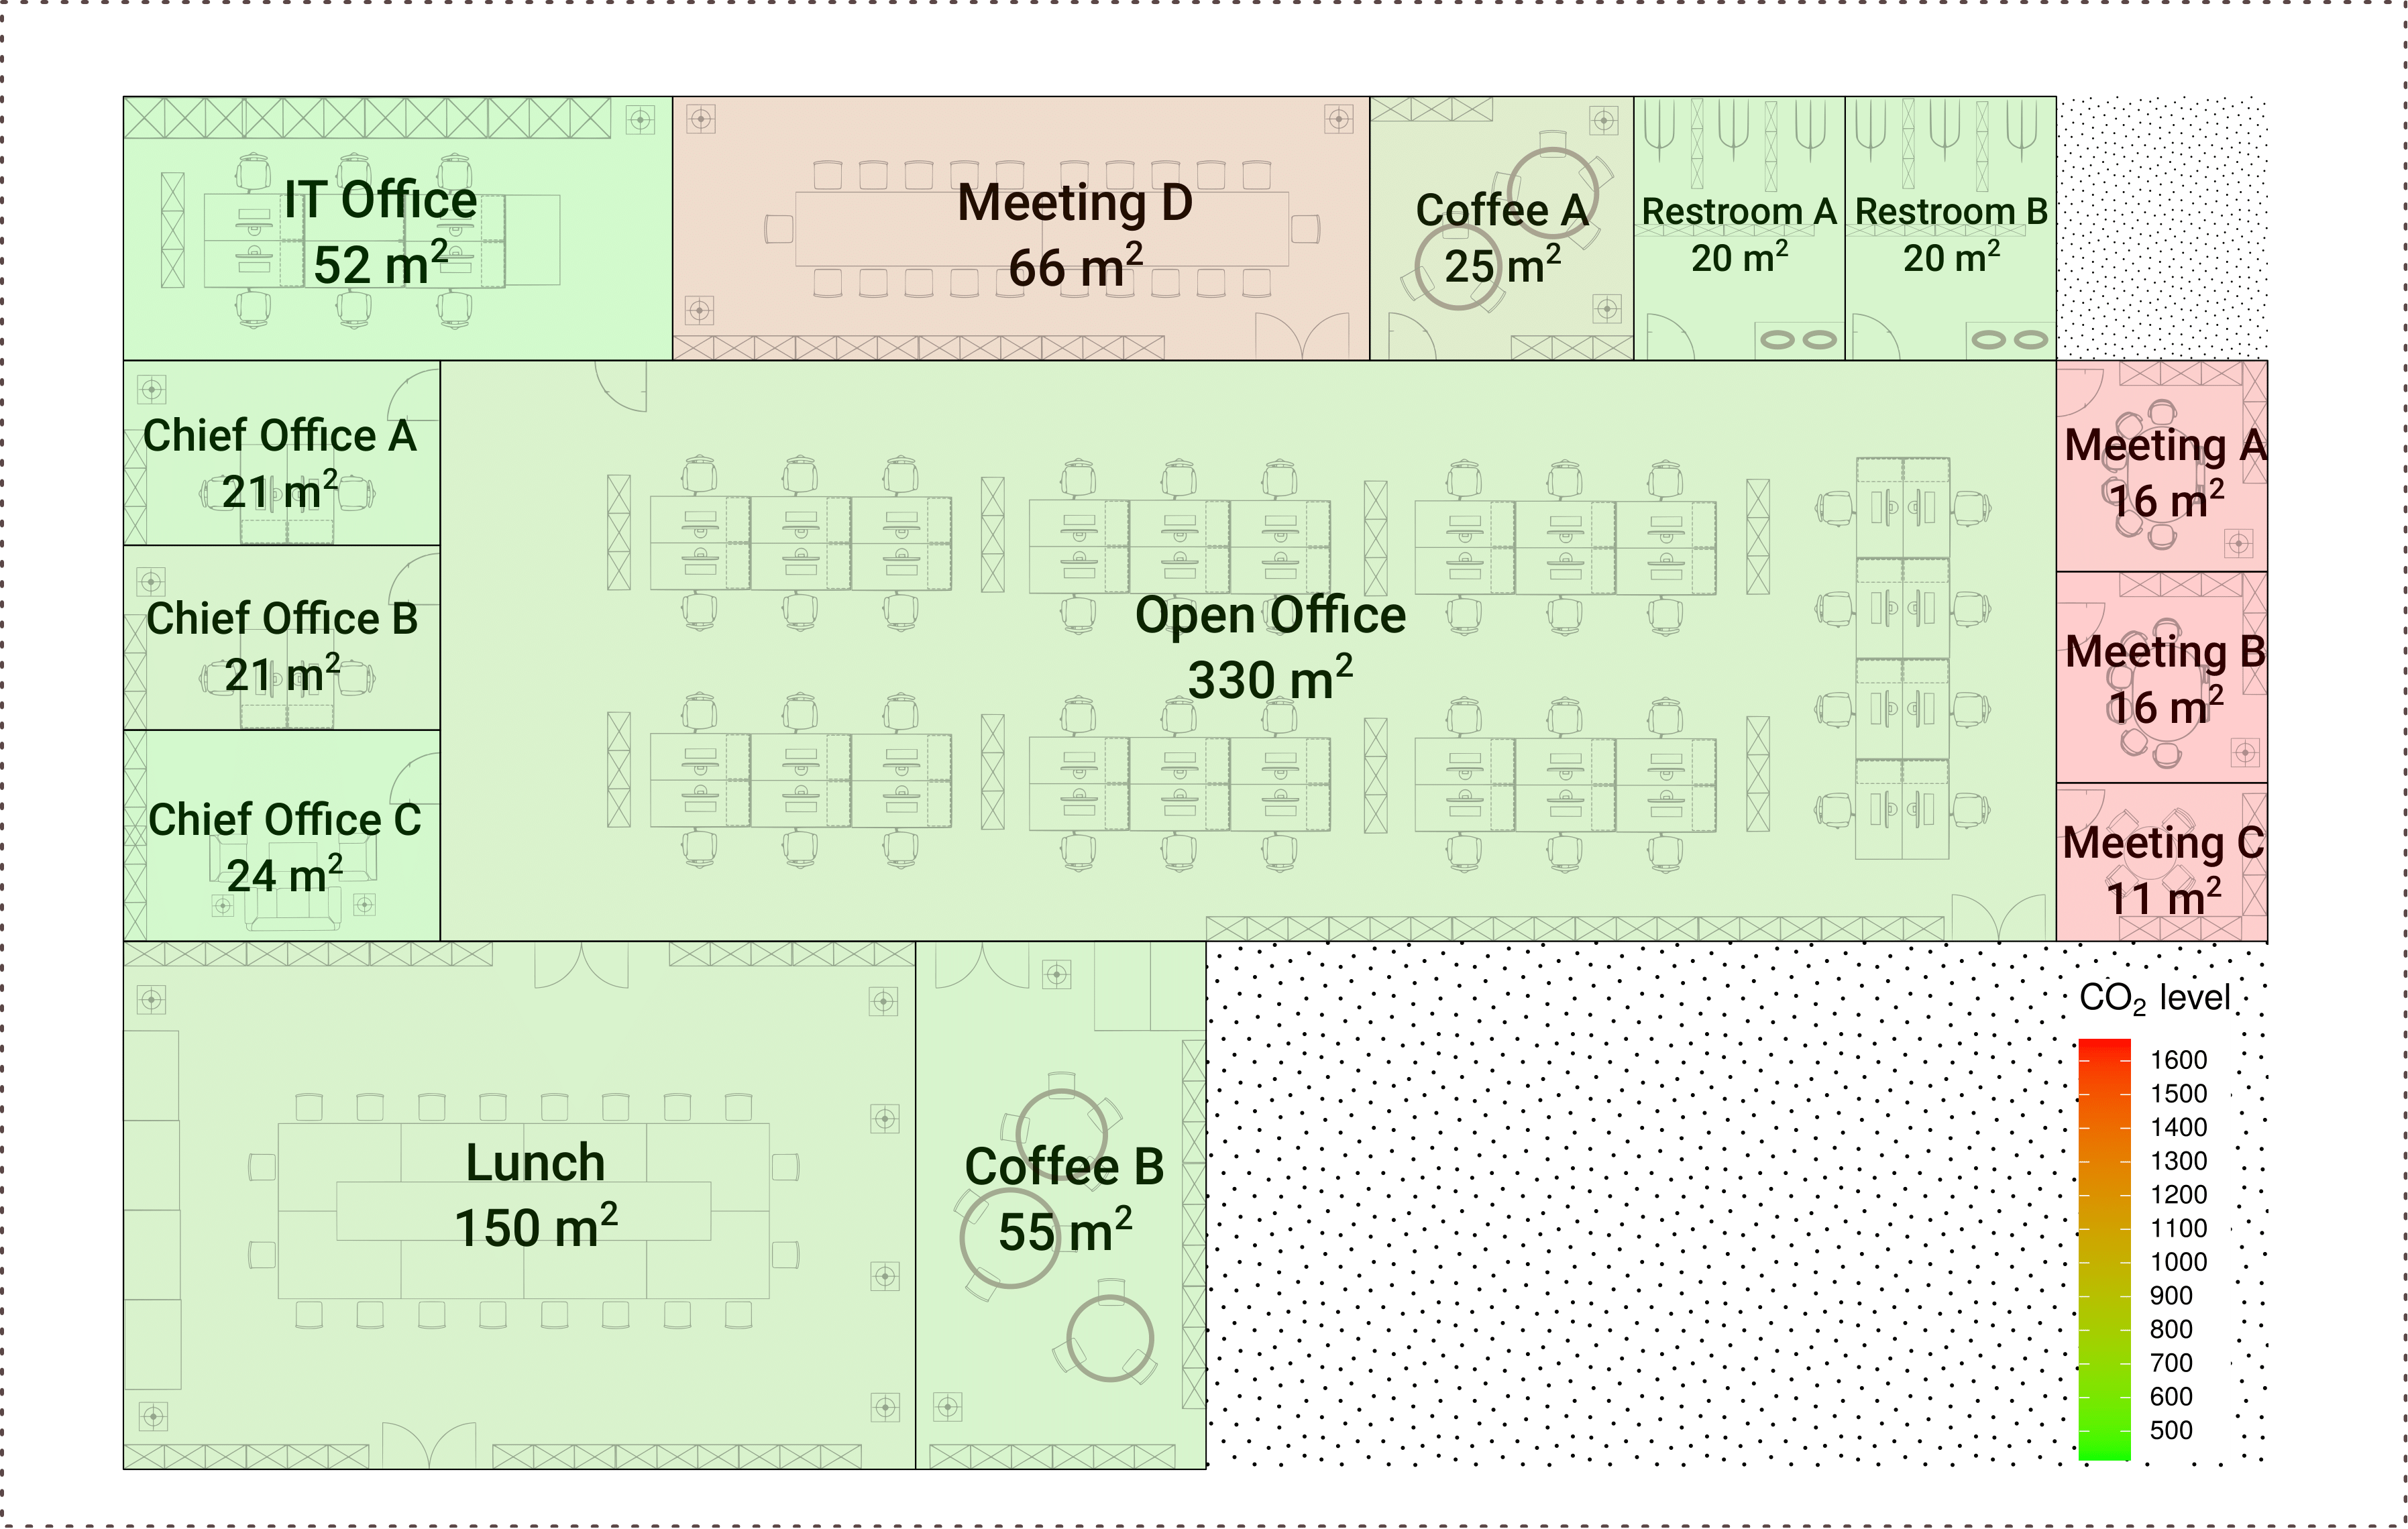
Figure 10: Maximum CO2 level at each place
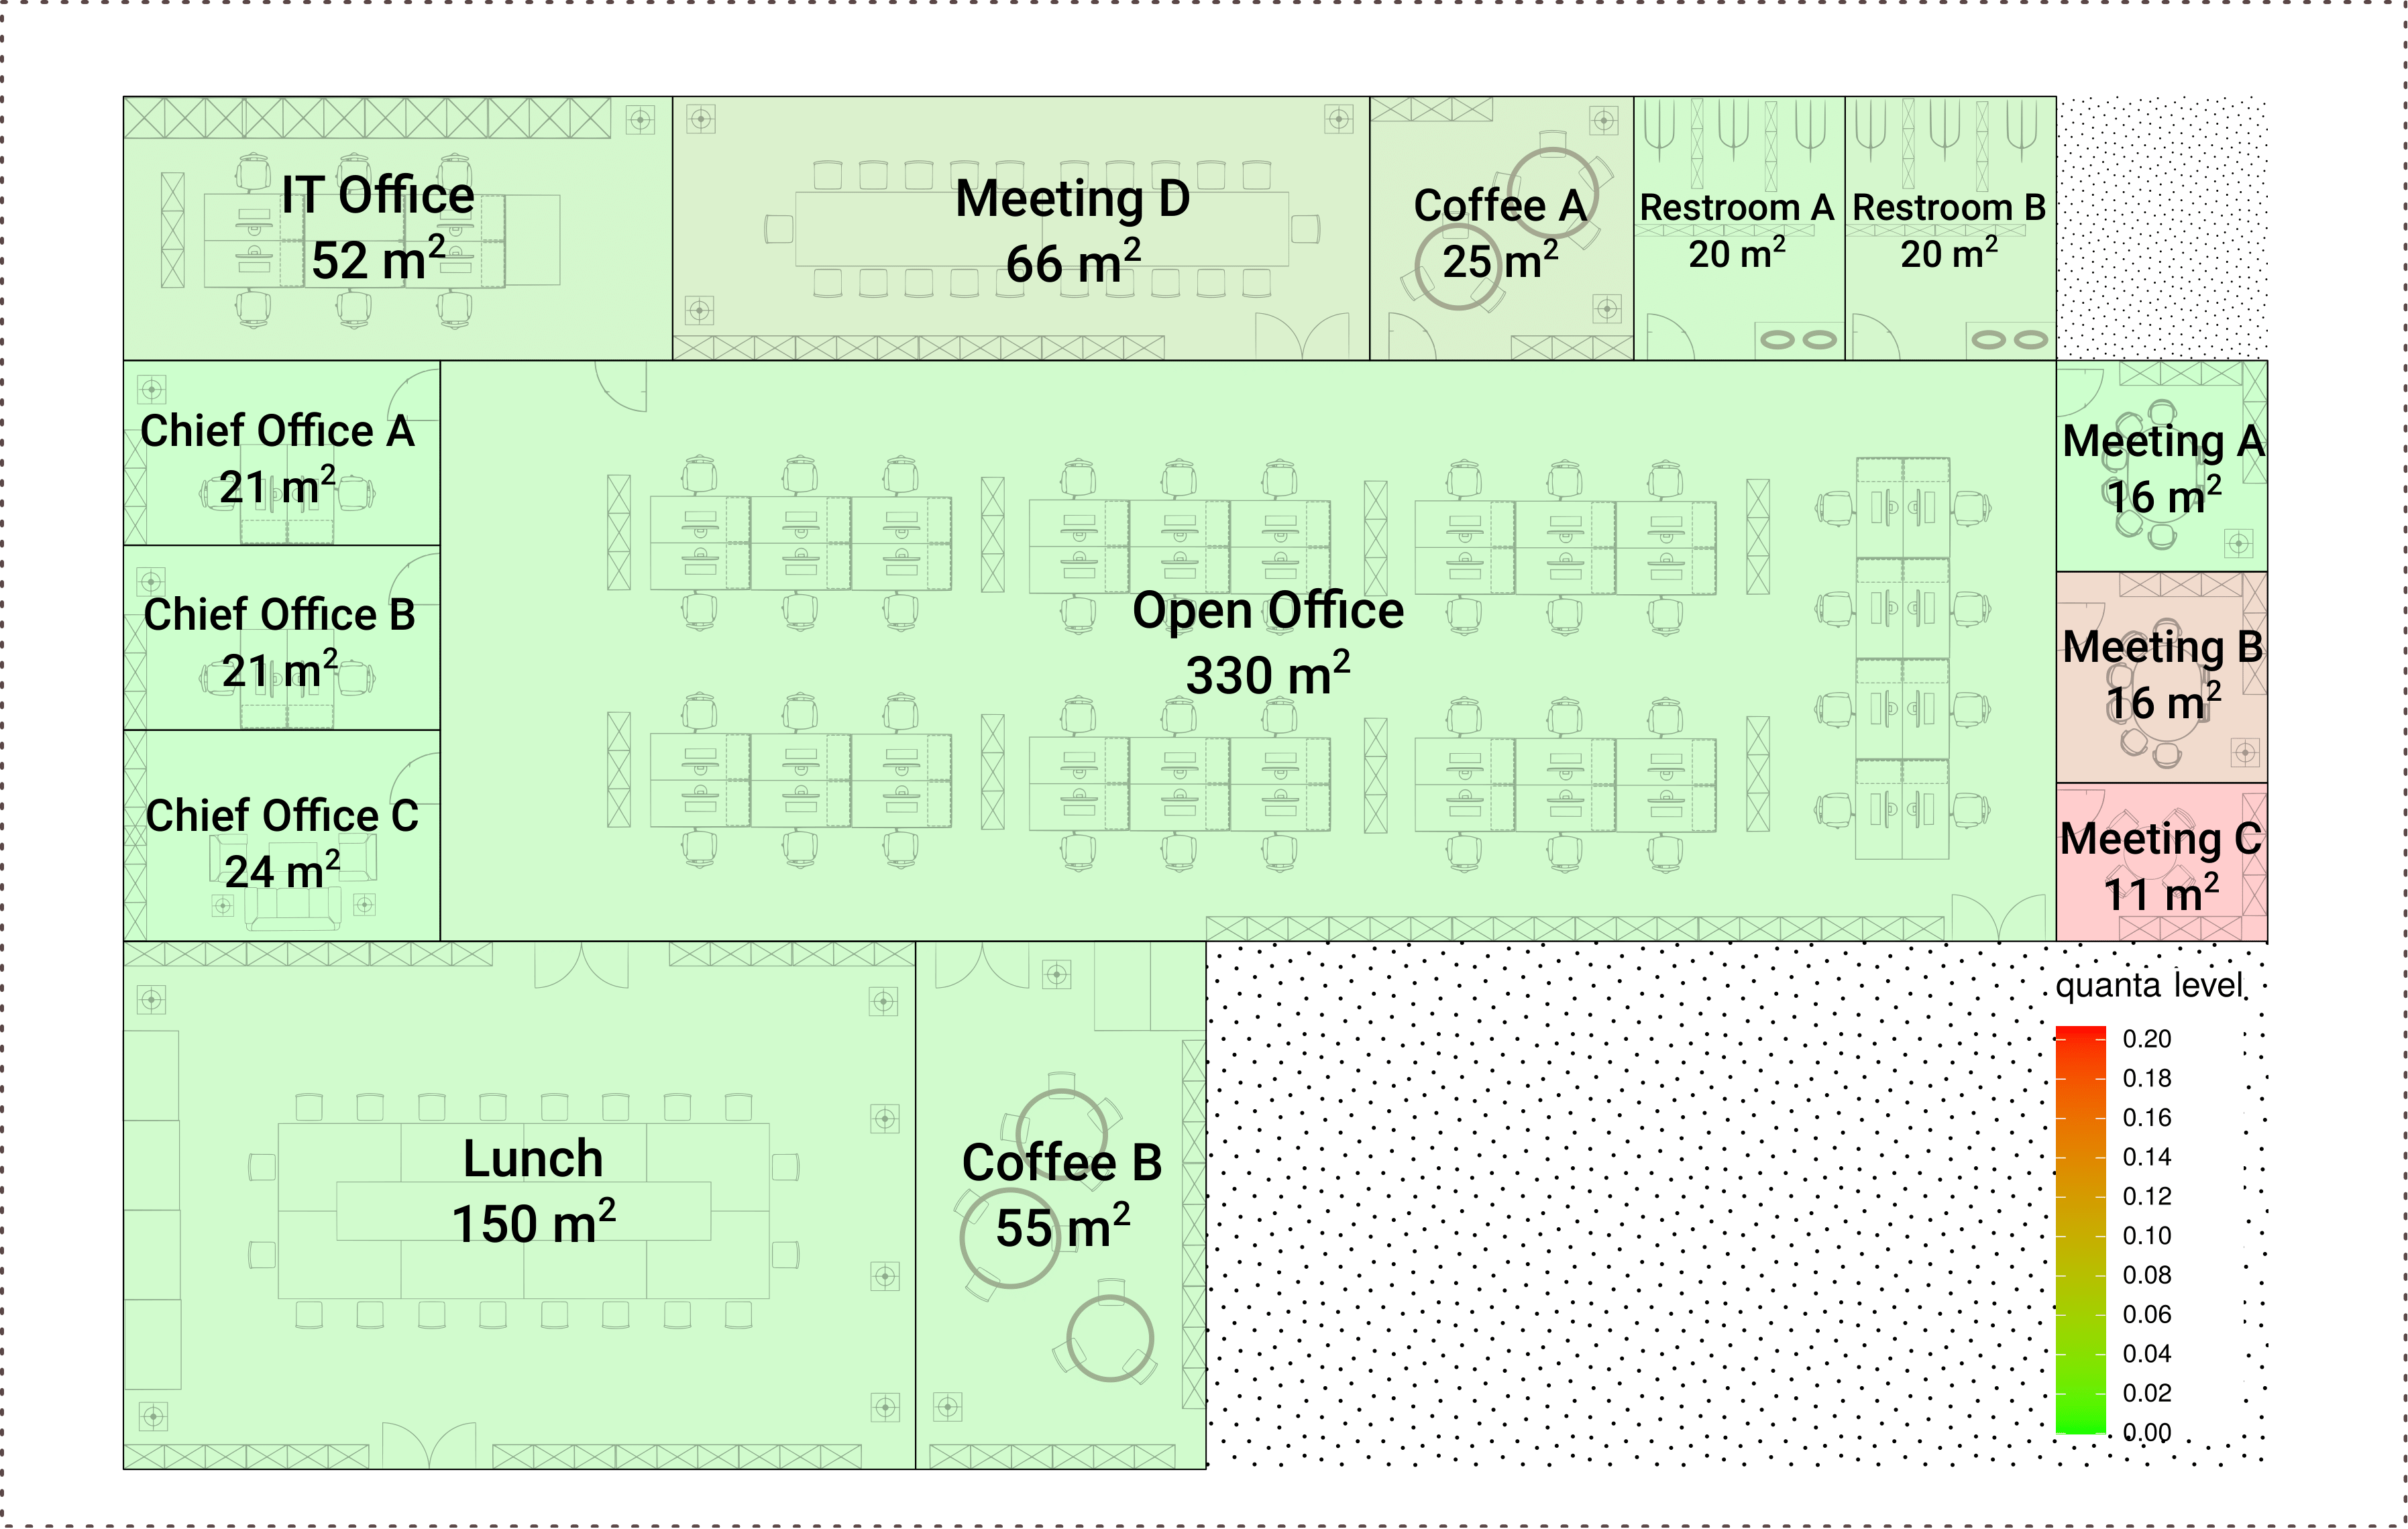
Figure 11: Maximum quanta level at each place
Note
It should be noted that the results in this section refer to a single simulation run and that the quanta-related metrics are very dependent on the randomly selected infected people. However, the high computational performance of archABM allows running multiple simulations and carry out robust statistical analysis.